01
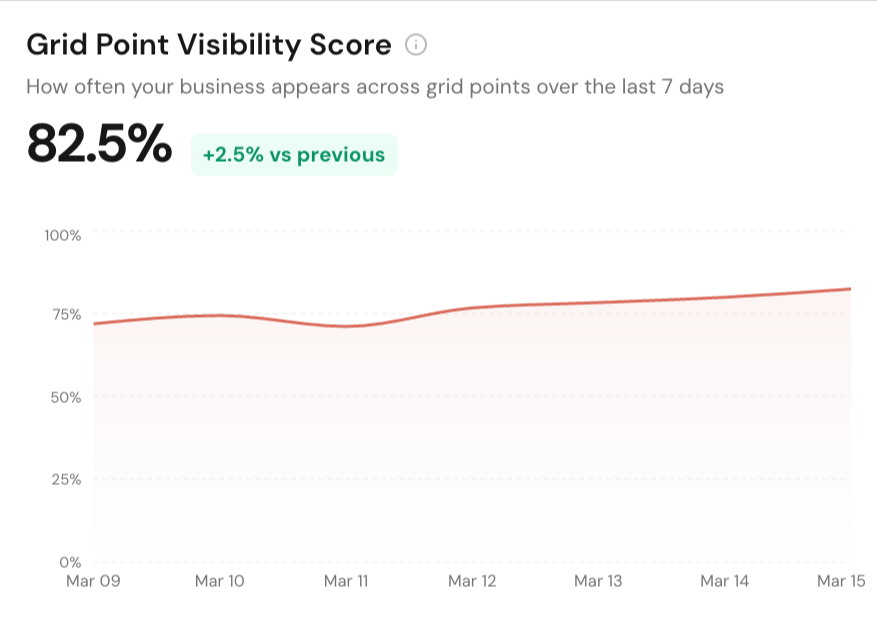
Grid Point Visibility Score
Measure the percentage of grid points where your business appears in Google Maps so coverage gains and losses are obvious at a glance.
Track grid point visibility, average rank, and local pack competitors in one place. Built for teams that need Google Maps rank tracking, location-based benchmarks, and share-ready reports.
Map Grid Features
Measure the percentage of grid points where your business appears in Google Maps so coverage gains and losses are obvious at a glance.
See average ranking at each simulated search location with color-coded cells that make strong pockets, weak zones, and blind spots easy to spot.
Run 3x3, 5x5, 7x7, or larger-style local coverage scans with configurable radius settings so the grid matches the real service area you care about.
Manage every tracked keyword in one table with average rank, rank change, Top 3 share, scan status, and last checked date across the project.
Compare historical scan periods to see whether visibility moved up or down by keyword, not just whether a single map screenshot looks better.
Refresh rankings on demand or schedule daily, weekly, or monthly scans so local pack tracking keeps running without manual follow-up.
Compare your Google rating and review count against nearby businesses discovered in scans to see whether review strength is helping or holding you back.
Rank competing businesses by threat score, appearance rate, keyword coverage, and average rank so you can focus on the businesses actually taking map visibility.
Inspect who showed up at each grid point and which business Google matched there, instead of treating the local pack like one city-wide position.
Track how many grid points land in the most important visibility bands so you can explain map performance in terms clients immediately understand.
Turn map grid scans into CSV, PDF, and shared report workflows so internal teams and clients can review performance without logging into the app.
Every grid point uses an exact location proxy, so each search returns the rankings a real customer at that spot would see in Google Maps, not a city-wide approximation.
Platform Features
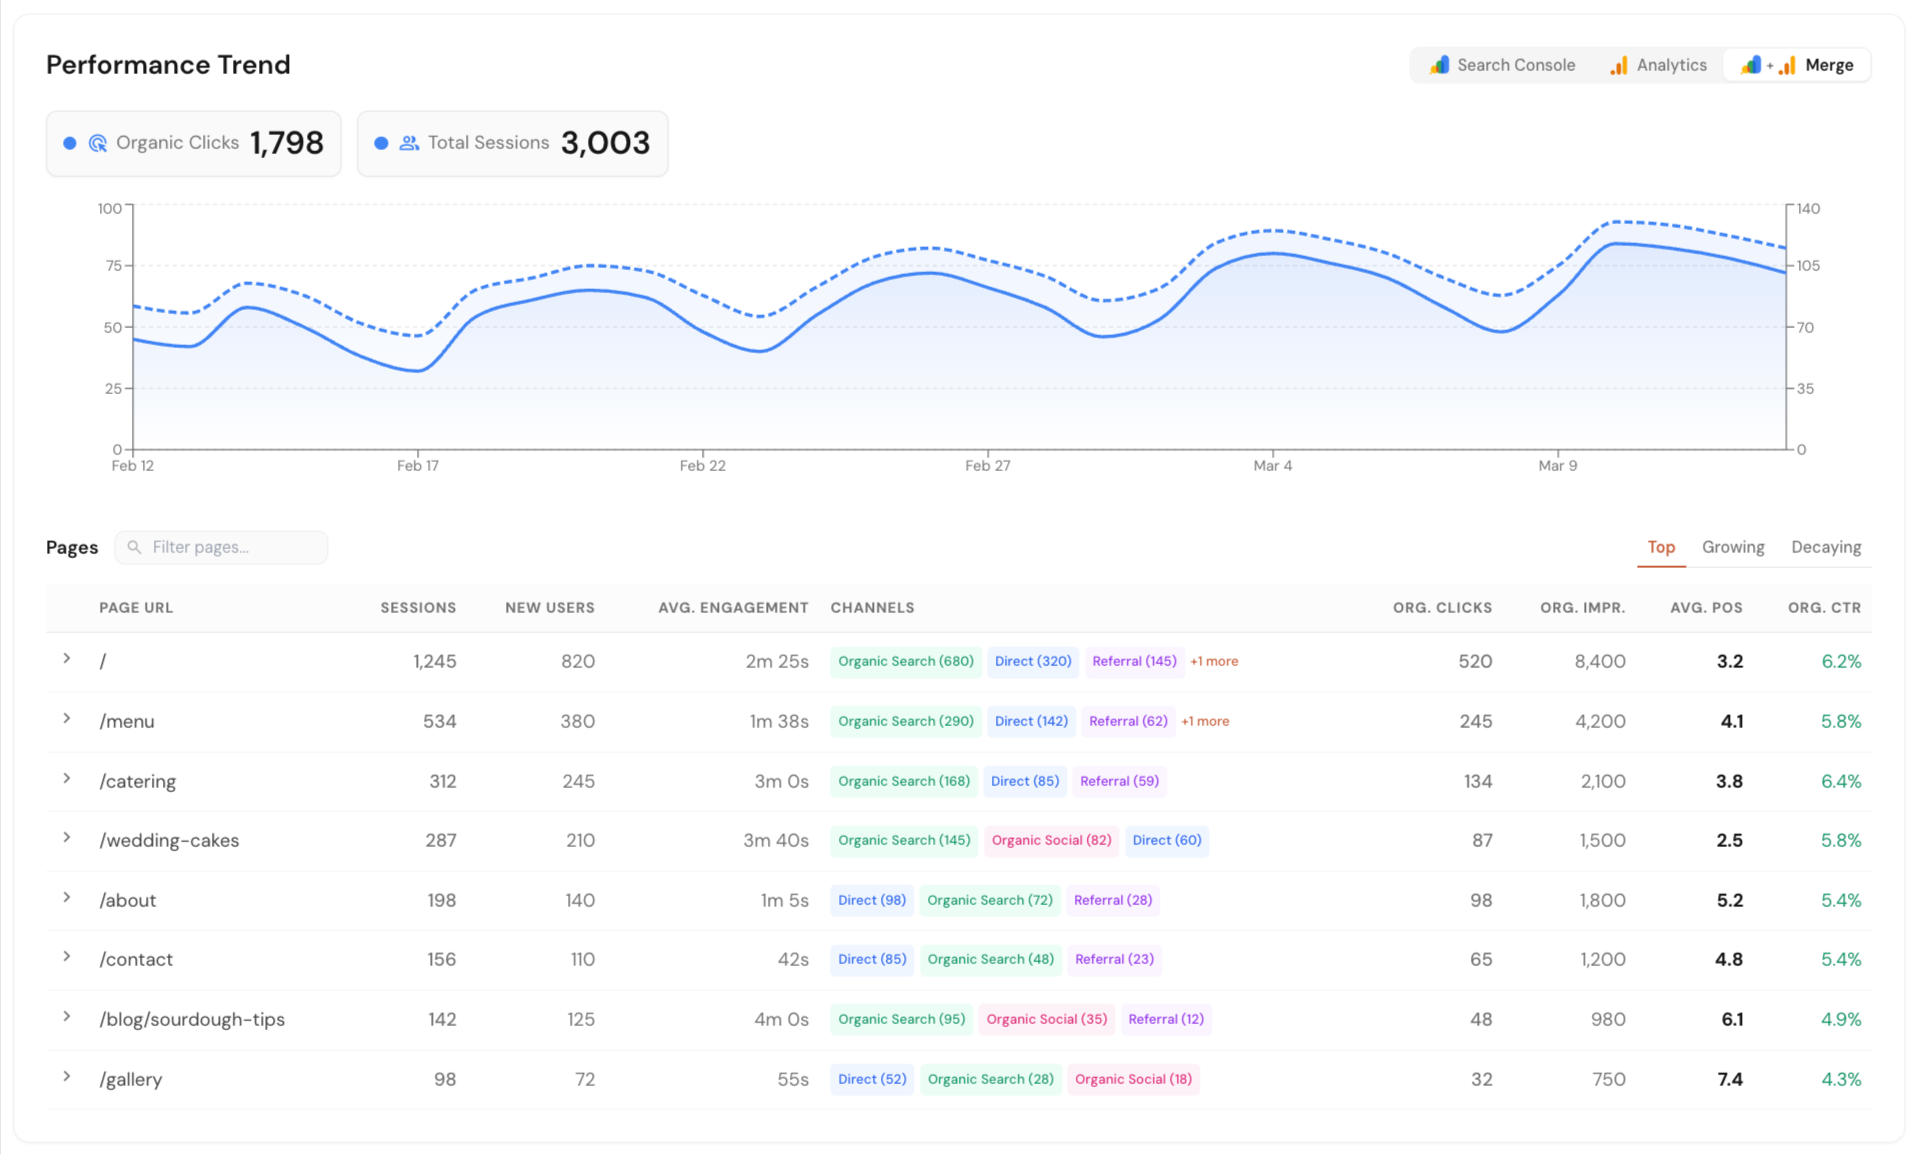
Connect Google Search Console, Google Analytics, and Google Business Profile in one dashboard. See local SEO data in one place without jumping between tools or reports.
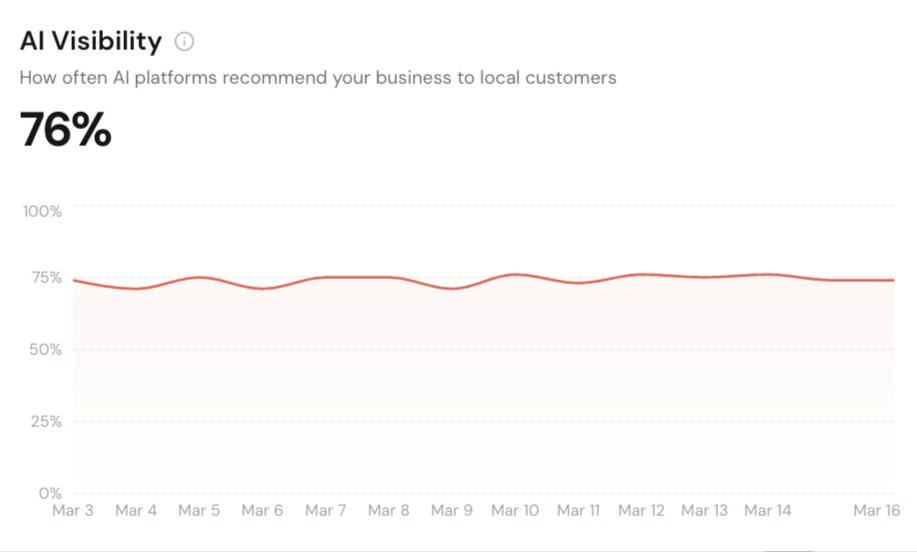
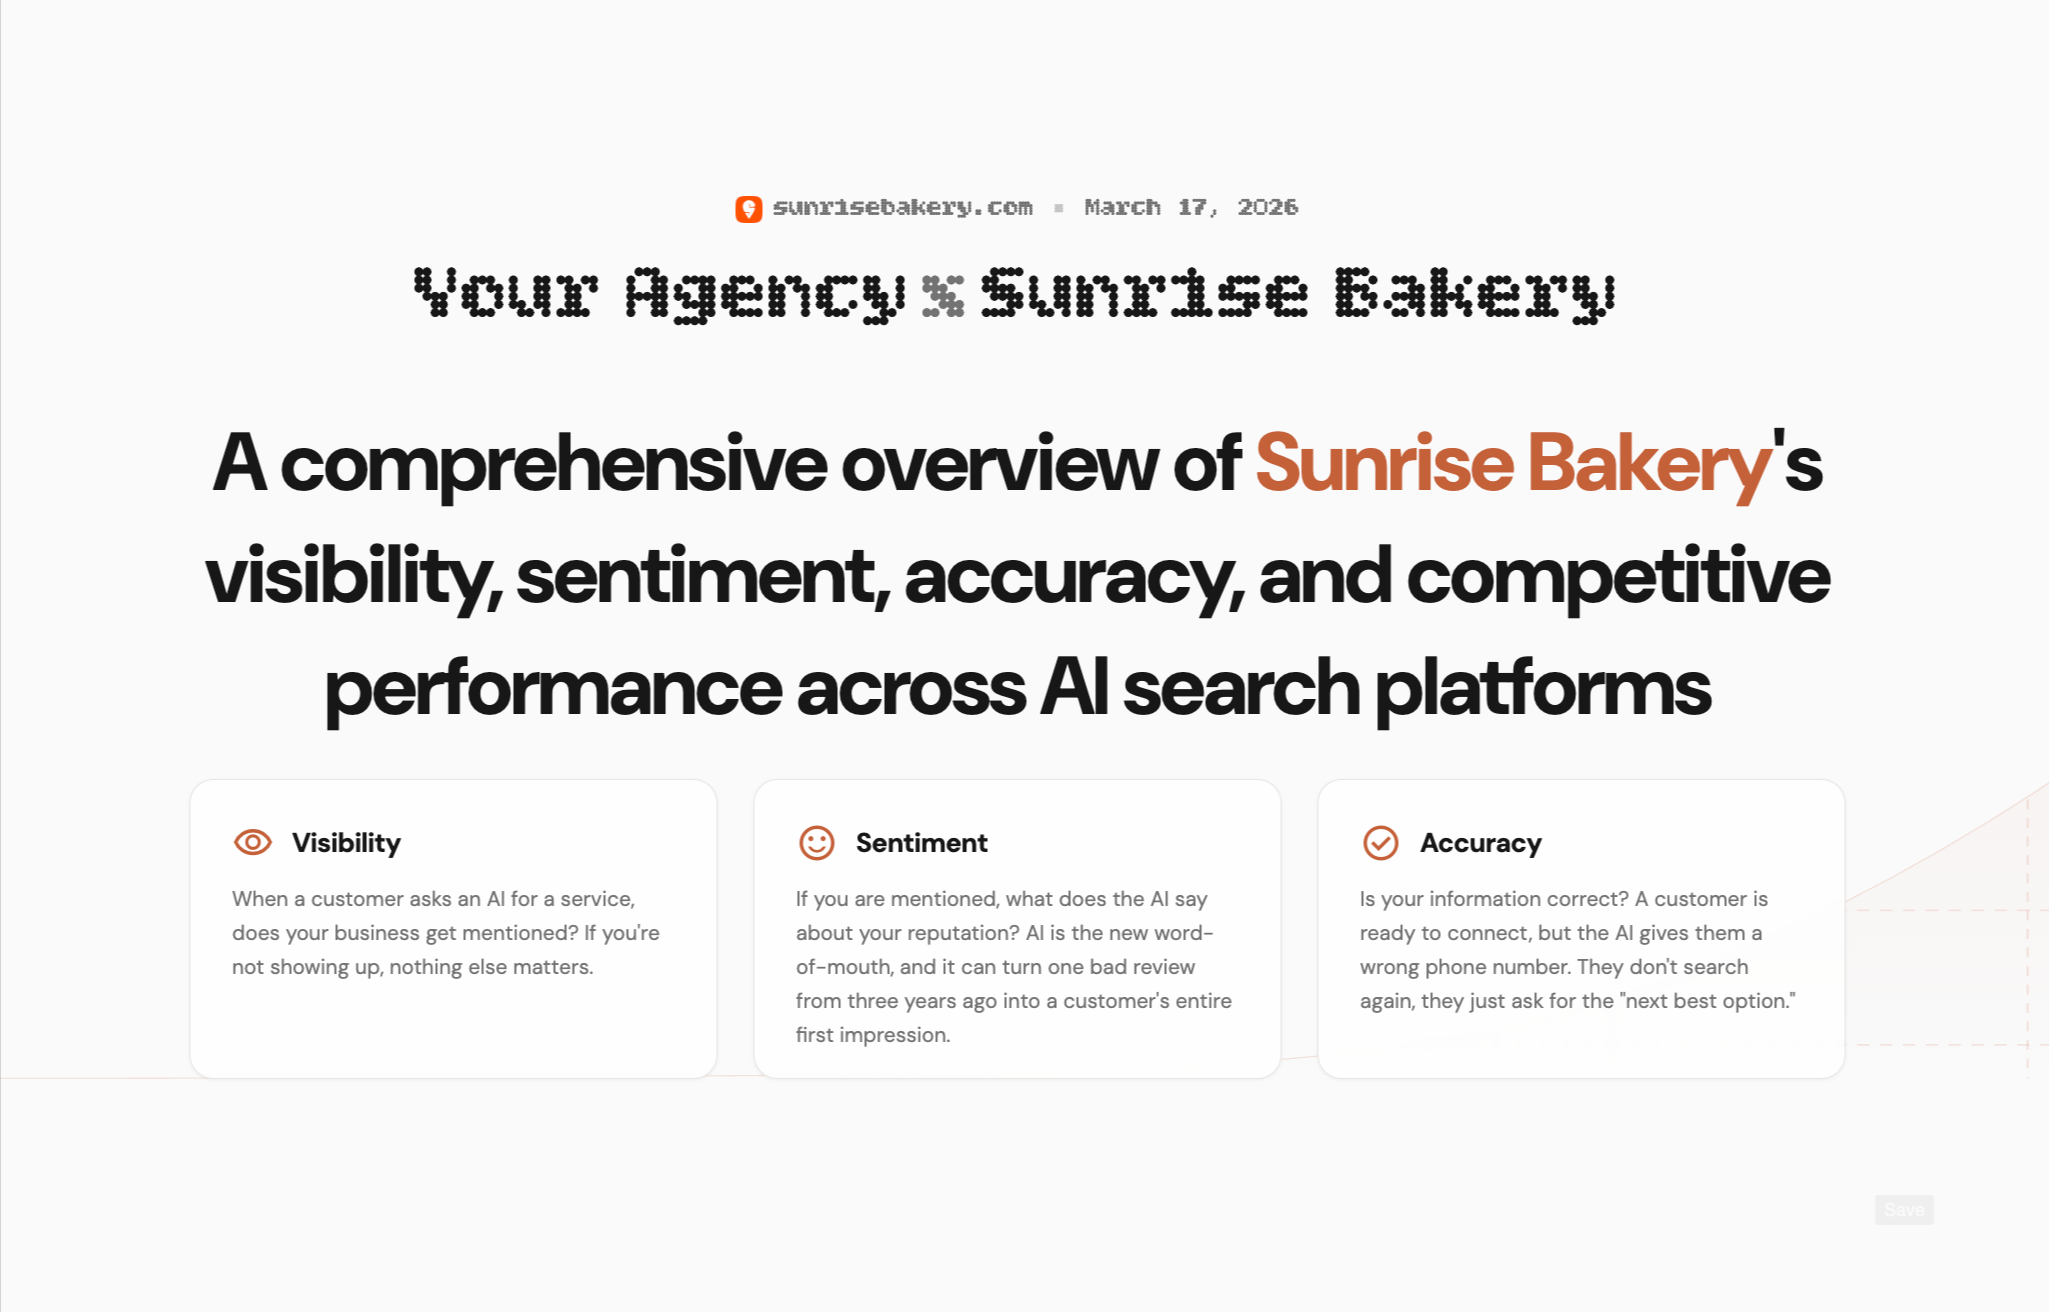
Track how your business shows up across Google AI Overview, ChatGPT, and Perplexity. Run scans on your schedule or only when needed.
See how your business ranks across different points in a local area. Get clear map ranking snapshots with simple reports you can export and share.
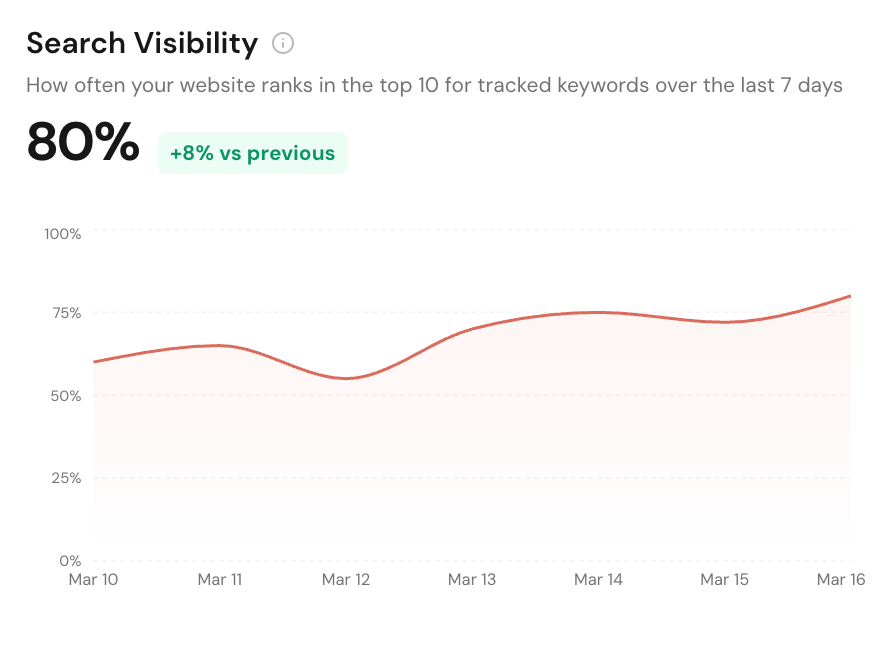
Track local service pages, blog posts, and keywords in Google Search. Monitor rankings, matched URLs, and competing domains from one dashboard.
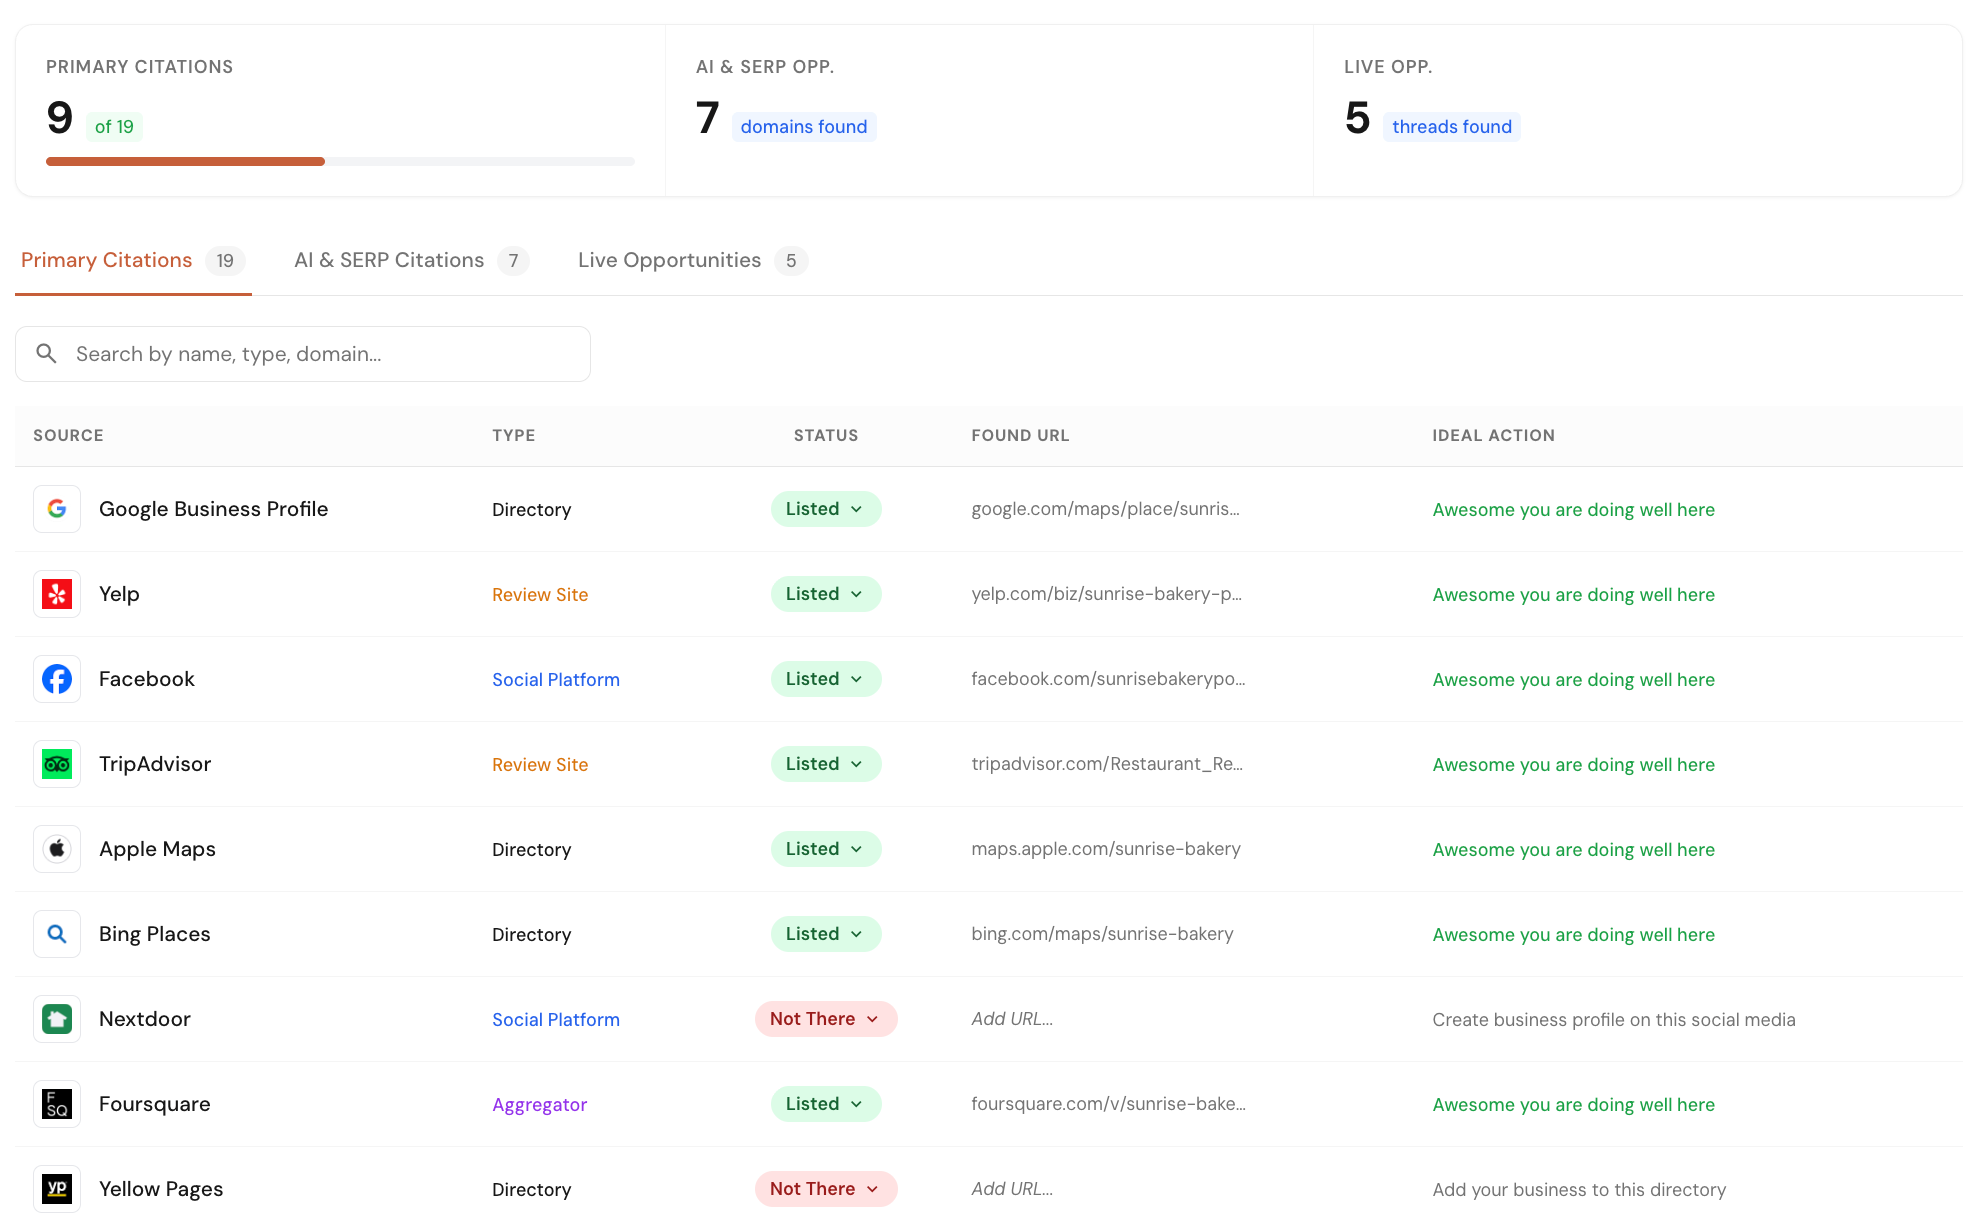
Check your business listings across 40+ core directories and map platforms. Find missed opportunities from listings, forums, and pages where competitors are already getting visibility.
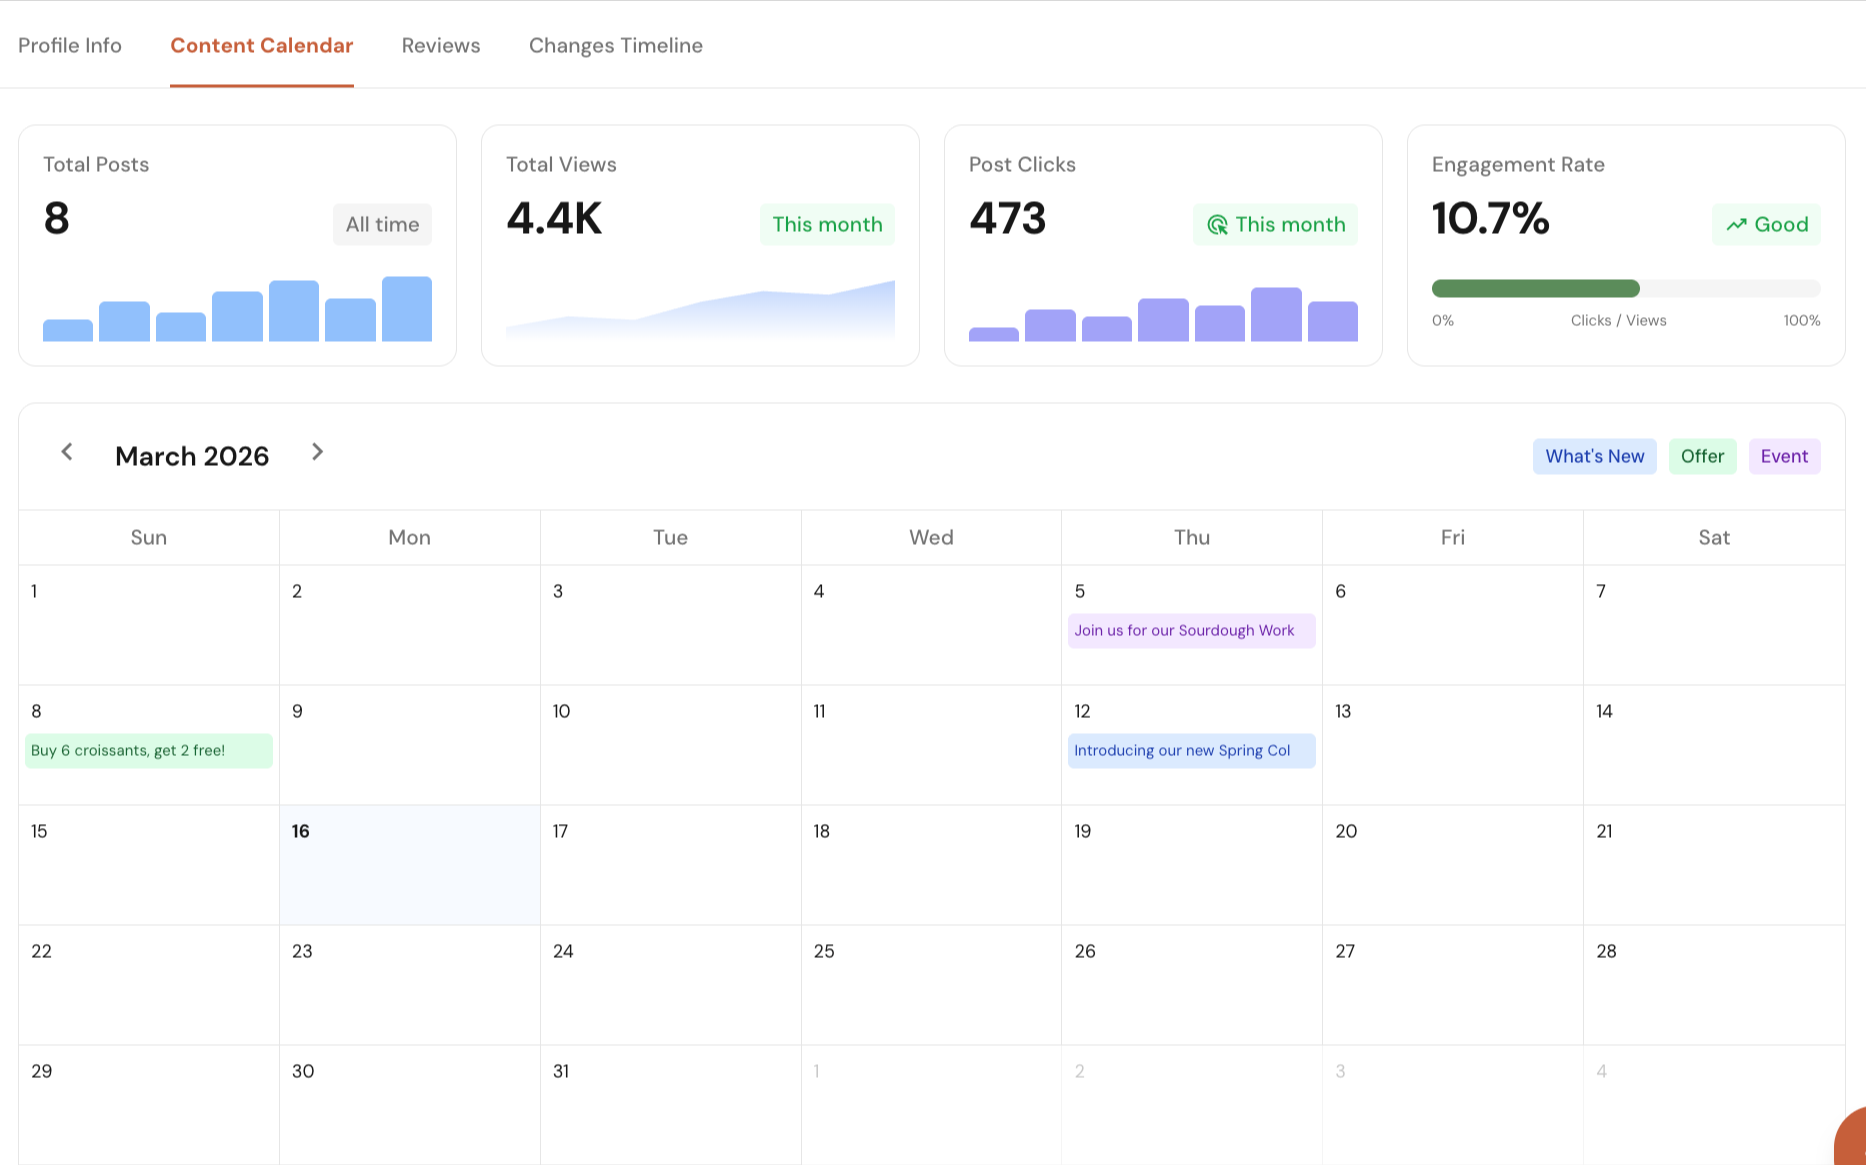
Manage your Google Business Profile directly from Local Glyph. Edit profile details, plan and schedule posts, track post performance, reply to reviews, and monitor profile changes with single-click approvals.
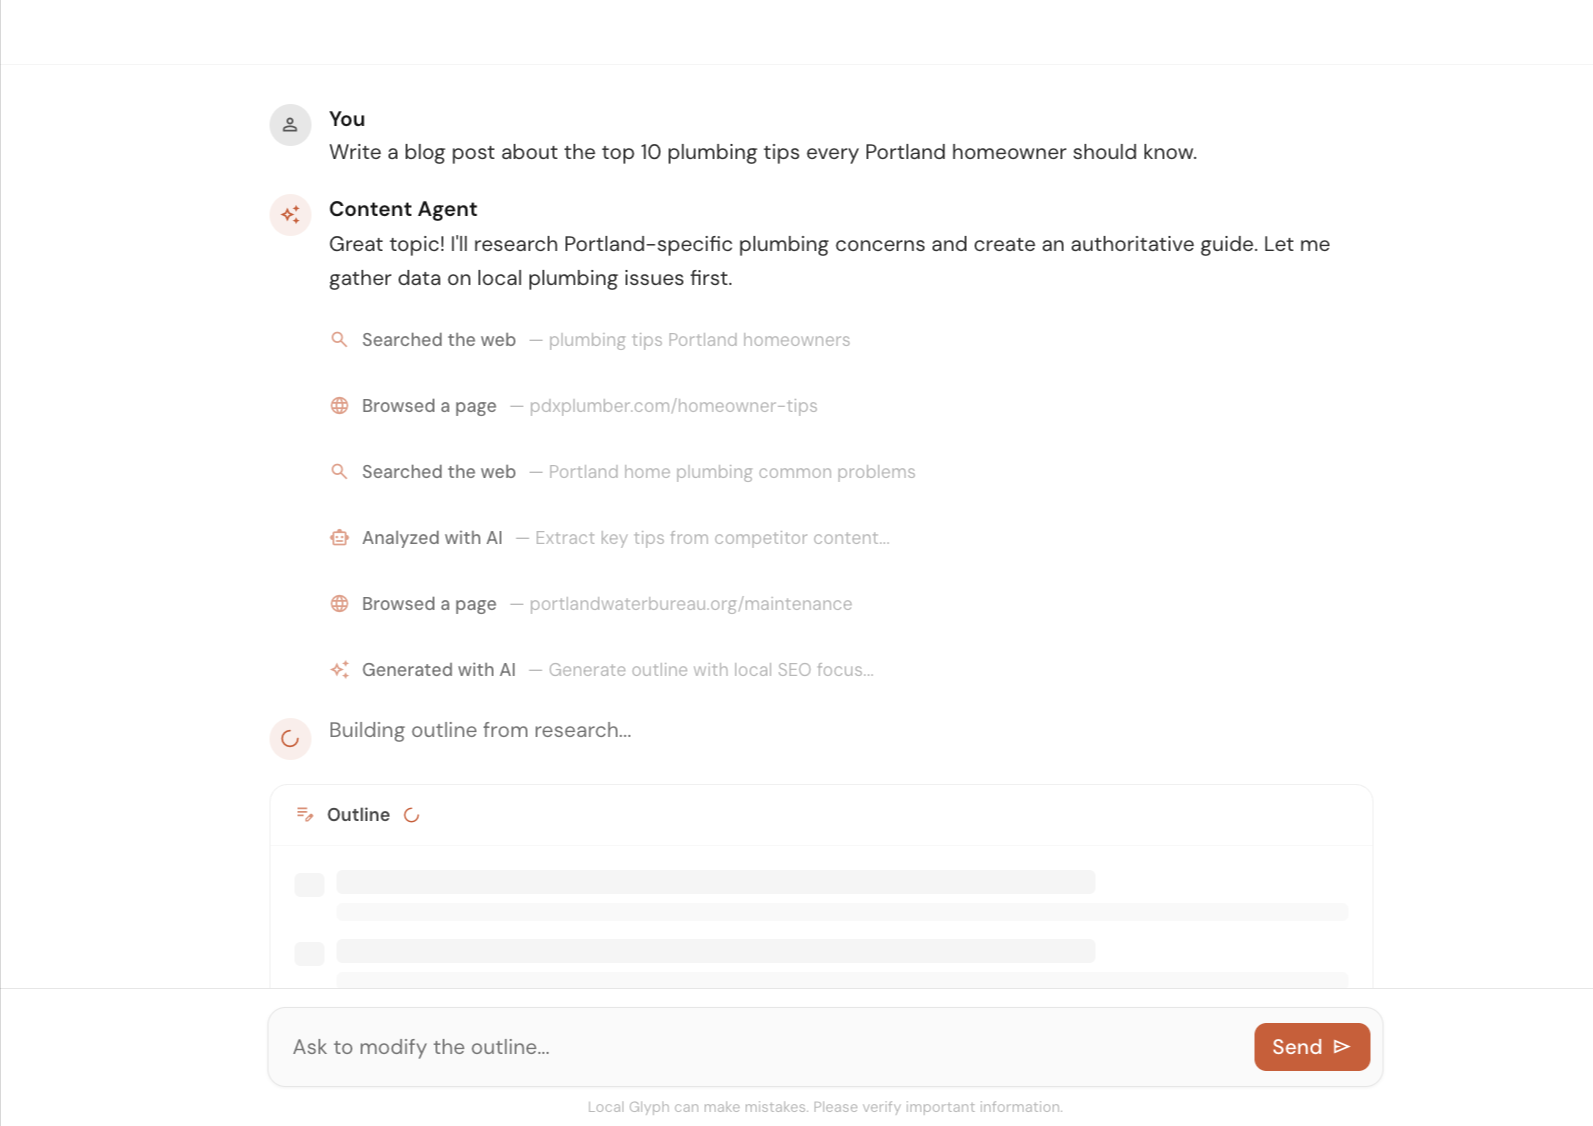
Create local SEO content faster with help on research, outlines, and first drafts. Use it to speed up the work, then let a human review and improve the final version.
Create client-ready reports for AI Visibility, Map Grid, and SERP Rank. Show where a business stands today, highlight gaps, and clearly explain where you can help improve local search performance.
Early Bird Pricing
Free$0/mo | Starter Pack$45/mo | Popular Growth Pack$175/mo | Pro Pack$500/mo | |
|---|---|---|---|---|
| Credits | 30 one-time | 30 / mo | 120 / mo | 350 / mo |
| AI Visibility scan (3 credits) | ||||
| Map Grid tracking (~0.30 cr per scan) | ||||
| SERP tracking (0.02 cr per keyword) | ||||
| Content Agent (~0.6–1.3 cr per article) | ||||
| Citation & Mention Finder (no credit cost) | ||||
| GBP Suite (no credit cost) | ||||
| Analytics (no credit cost) | ||||
| Unlimited projects | ||||
| White-label reporting | — | |||
| Credits roll over (1 month) | — | |||
| Get started for free | Get started for free | Get started for free | Get started for free |
FAQs
It measures how your Google Business Profile ranks across multiple points in a local area instead of treating one search from one location as the full picture. You can see grid point visibility, average rank, Top 3 coverage, Top 10 coverage, and where you are not found at all.
Yes. Local Glyph supports configurable grid sizes and scan radius settings so you can match the map grid to a tight downtown footprint or a wider service area.
Yes. The dashboard stores which business appeared at each grid point, then rolls that up into review benchmarking and competitive benchmarking so you can see who is winning where.
Yes. You can run scans manually whenever you need a fresh snapshot or enable daily, weekly, or monthly auto-scans so rankings keep updating in the background.
Map grid scans use the business address and coordinates saved in your project's source of truth. Keeping that location accurate matters because it defines the center point of every scan.
Yes. Local Glyph supports CSV exports and shareable reporting workflows, and map grid reports are designed to be usable by internal teams or clients without manual screenshot stitching.
Yes. Agencies use it to manage recurring local rank checks across clients, while business owners use it to understand which neighborhoods or service areas are actually strong or weak in Google Maps.
Email us at [email protected] or use the chat icon in the bottom-right corner of the screen. We genuinely appreciate your feedback.